Climatographs Reimagined
I've never really liked teaching climatographs, although they're part of the Science 10 curriculum. So here's an activity that has students create and learn to read a climatograph, while introducing the concept of biomes in a logical way.
Downloads:
|
|
|
A useful list of cities (don’t tell students what the biome is):
Tundra:
|
Taiga/Boreal Forest:
|
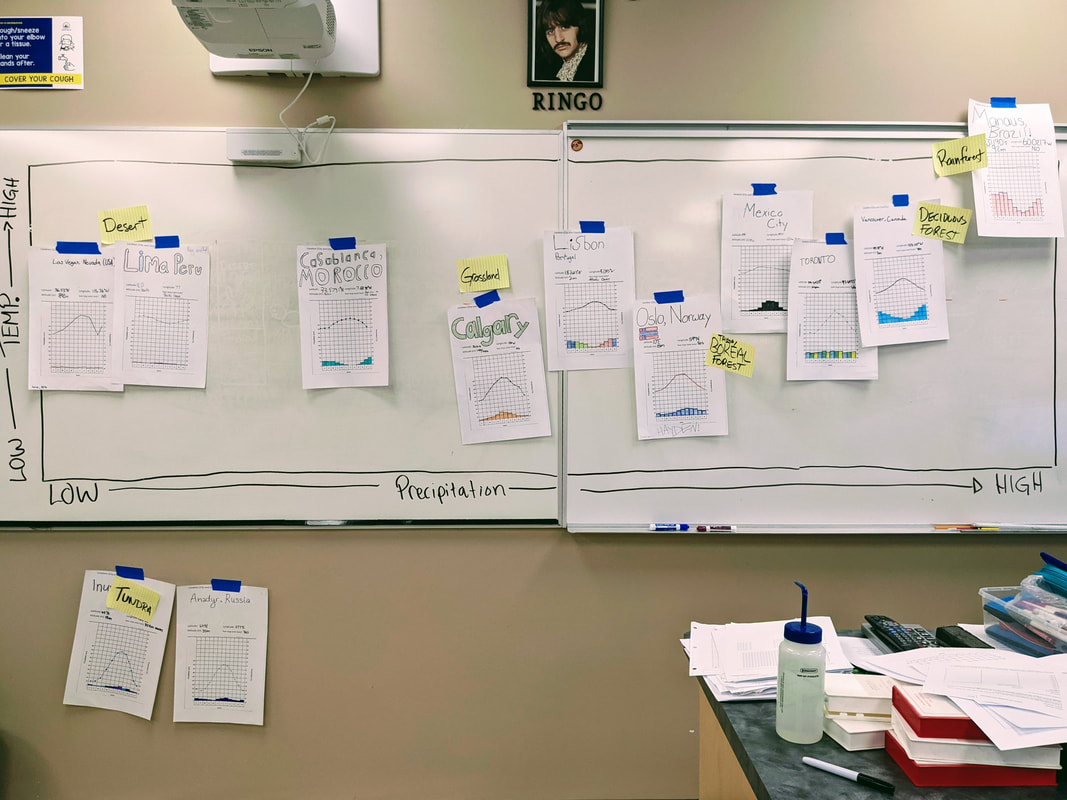
2. Once they have completed their table, have them build the climatograph for their city on a 11x17 piece of paper (“grid paper handout.docx”), and tape it randomly to the front whiteboard.
3. Once all climatographs are on the board, have students order them from low precipitation (left) to high precipitation (right). I like to sit down and make students do this, where each student can only get up once and can only move 2 climatographs.
4. Once students/teacher are satisfied with the order, add a y-axis label (temperature lowàhigh), and have them move the cities up/down on the basis of their average temperature.
5. I like to come along now and add stickies with the biome labels, having students help assign them to the correct areas.
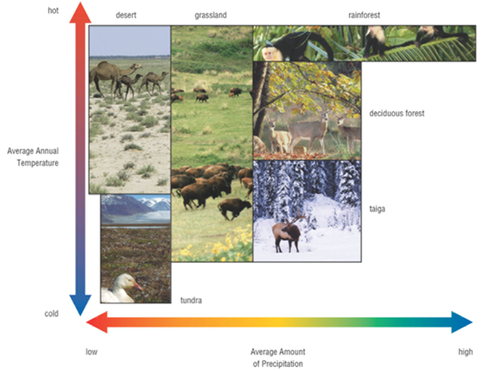
6. Then we reference a generalized grid, like the one below, to see how the generalizations align with the decisions we make, and discuss how areas can transition between biomes as a result of climate change.
7. Leaving climatographs on the board, have students answer the questions on their handout in their groups.
3. Once all climatographs are on the board, have students order them from low precipitation (left) to high precipitation (right). I like to sit down and make students do this, where each student can only get up once and can only move 2 climatographs.
4. Once students/teacher are satisfied with the order, add a y-axis label (temperature lowàhigh), and have them move the cities up/down on the basis of their average temperature.
5. I like to come along now and add stickies with the biome labels, having students help assign them to the correct areas.
6. Then we reference a generalized grid, like the one below, to see how the generalizations align with the decisions we make, and discuss how areas can transition between biomes as a result of climate change.
7. Leaving climatographs on the board, have students answer the questions on their handout in their groups.